The Poisson distribution is a discrete probability distribution that models the number of events occurring in a fixed interval of time and/or space, where these events occur with a known average rate and independently of the time since the last event. It is commonly used to model the number of times an event happens in a fixed interval of time or space, where the events occur independently and at a constant average rate. The Poisson distribution is named after French mathematician Siméon Denis Poisson, who published its first analysis in the 19th century.
Understanding the Poisson Distribution

The Poisson distribution is characterized by a single parameter, λ (lambda), which is the average rate of events occurring in the given interval. This distribution is widely used in many fields, including finance, engineering, and the social sciences, to model various phenomena such as the number of phone calls received by a call center, the number of defects in a manufacturing process, or the number of accidents happening within a certain area over a specific period.
Key Characteristics of the Poisson Distribution
Some key characteristics of the Poisson distribution include:
- Discrete: The Poisson distribution models discrete data, meaning the outcome can only take on non-negative integer values (0, 1, 2,…).
- Single Parameter: The distribution is characterized by a single parameter, λ, which is both the mean and variance of the distribution.
- Independence: The events modeled by the Poisson distribution are assumed to occur independently of each other.
- Constant Average Rate: The events occur at a constant average rate, denoted by λ.
| Parameter | Description |
|---|---|
| λ (lambda) | Average rate of events occurring in the interval |
| k | Number of occurrences |
| P(k;λ) | Probability of k occurrences |

Poisson Distribution Calculator Formula

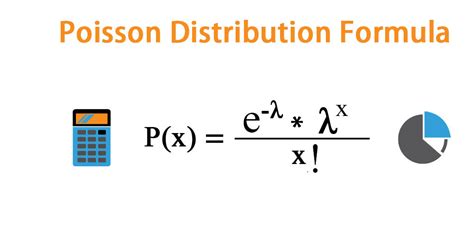
The probability of k events happening in a fixed interval is given by the formula:
P(k;λ) = (e^(-λ) * (λ^k)) / k!
where:
- e is the base of the natural logarithm (approximately 2.71828)
- λ is the average rate of events
- k is the number of events
- k! denotes the factorial of k
How to Use the Poisson Distribution Calculator
To use the Poisson distribution calculator, you need to know the average rate of events (λ) and the number of events (k) you are interested in. You then plug these values into the formula to calculate the probability.
Key Points
- The Poisson distribution is a discrete probability distribution modeling the number of events in a fixed interval.
- It is characterized by a single parameter, λ, the average rate of events.
- The distribution is widely used in finance, engineering, and social sciences for modeling various phenomena.
- The Poisson distribution calculator is a tool for computing probabilities based on the average rate of occurrence.
- Understanding the Poisson distribution and its calculator can aid in decision-making and risk analysis in real-world applications.
Applications of the Poisson Distribution Calculator
The Poisson distribution calculator has numerous applications across different fields. For instance, in quality control, it can be used to model the number of defects in a manufacturing process, helping to identify if the process is within acceptable limits. In finance, it can model the number of transactions over a certain period, aiding in the assessment of operational risks. In healthcare, it can model the number of patients arriving at an emergency department, helping in the planning of resources.
Benefits of Using the Poisson Distribution Calculator
The benefits of using the Poisson distribution calculator include:
- Prediction of Event Probabilities: It allows for the calculation of the probability of specific numbers of events occurring, which is crucial for planning and decision-making.
- Efficient Resource Allocation: By understanding the likelihood of different numbers of events, organizations can allocate resources more efficiently.
- Risk Analysis: The calculator aids in assessing risks associated with different scenarios, helping in the development of strategies to mitigate these risks.
What is the Poisson distribution used for?
+The Poisson distribution is used to model the number of times an event happens in a fixed interval of time or space, where the events occur independently and at a constant average rate.
How do you calculate the probability using the Poisson distribution?
+The probability is calculated using the formula P(k;λ) = (e^(-λ) * (λ^k)) / k!, where λ is the average rate of events, k is the number of events, and e is the base of the natural logarithm.
What are the key characteristics of the Poisson distribution?
+The key characteristics include being discrete, having a single parameter (λ), assuming independence of events, and having a constant average rate of occurrence.
